Framework: Managing High-Risk Operational Pathways in Complex Systems
1. Business Problem & Context
In public sector environments, success is driven by risk mitigation and system stability rather than pure profit. The core challenge is using Business Analysis (BA) tools to evaluate recurring high-risk incidents and accurately identify when a system has reached its “saturation point”.
2. Stakeholders & Intended Users
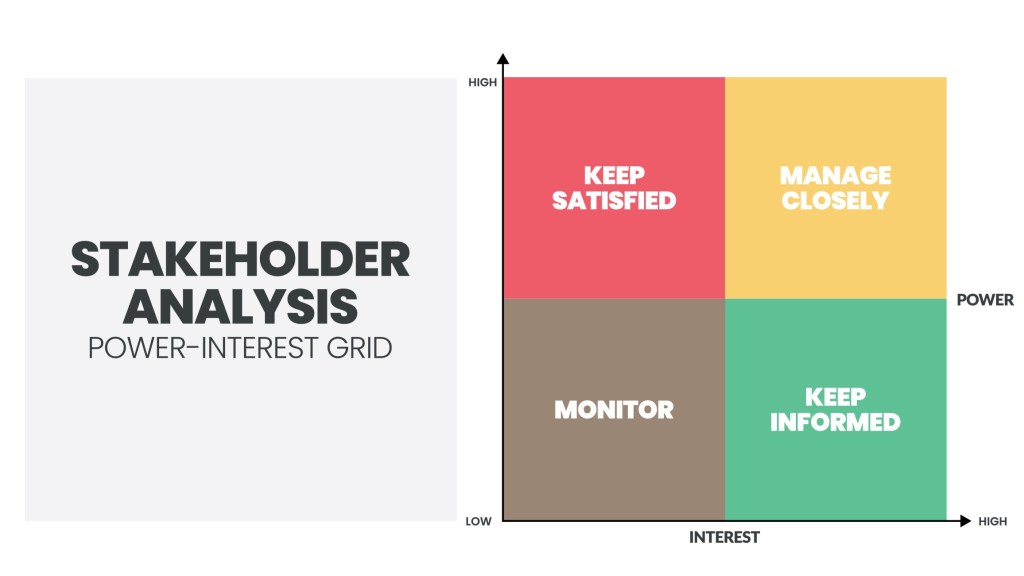
Managing crises in a public setting requires balancing diverse needs using a Power-Interest Grid:
- Decision Makers: Leadership teams holding the power to change the “TO-BE” state.
- Operational Staff: Teachers and support staff who possess high interest but restricted power over system-wide changes.
- The Wider Cohort: Individuals impacted by the “ripple effects” of systemic disruptions.
3. Requirements & Success Measures
- Requirements: Map out the recurring escalation cycles to identify systemic breakdowns and process saturation.
- Success Measures: Successfully move the organization from a state of subjective stress to one of objective strategy through structured analysis and defined metrics.
4. Data Understanding, Assumptions & Limitations
- System Constraints: The analysis assumes that proactive “TO-BE” states are often heavily restricted by legal, safeguarding, and budgetary limits.
- Symptoms vs. Causes: A core assumption of the framework is that surface-level behaviors are “symptoms” that must be separated from true “systemic causes”.
5. Analytical Approach & Tools
- Core Approaches: The project applies Systems Thinking, Process Mapping, and Root Cause Analysis (RCA).
- Stakeholder Analysis: Utilized a Power-Interest Grid to properly classify stakeholders based on their influence and interest to prioritize communication.
6. Validation & Responsible Analytical Practice
- Root Cause Analysis (RCA): Applied strictly to break the cycle of recurring issues by investigating “Environmental Mismatch”—evaluating whether the current setting is actually capable of meeting the stakeholder’s needs.
7. Dashboard, Solution or Business Output
The solution provided a defined set of performance metrics alongside a mapped escalation cycle.
The “AS-IS” Escalation Cycle Process Map:
- The Incident: A high-risk event occurs.
- The Reaction: Immediate intervention and recording are executed.
- The Layering: More interventions are added without removing the original stressors.
- The Reintegration: A return to the status quo until the cycle inevitably repeats.
Engineered KPIs:
- Incident Frequency & Severity: Tracking trends over time.
- Intervention Efficacy: Determining which support measures correlate with actual risk reduction.
- Resource ROI: Comparing the cost of the status quo against the cost of a system change.
8. Findings & Recommendations
- Process Saturation: The analysis revealed that simply layering more resources onto a broken process leads to saturation. This increases staff fatigue while leaving results completely stagnant.
9. Impact, Expected Value & Validation
- Strategic Action: By mapping the process constraints and applying specific KPIs, the framework provides the objective evidence needed to facilitate a strategic move to a more specialized setting, ensuring safety and progress.
10. Reflection & Next Steps
Key Takeaway: The project highlights that sometimes the most valuable outcome of Business Analysis is the realization that a process is fundamentally constrained by external rules, and the current system is no longer the appropriate environment.